Anatomy of a Printer Emulator
 How a New Emulator is Born

We were faced with a rather interesting challenge recently when a watch enthusiast asked if we could emulate the Seiko QT-2100P printer.
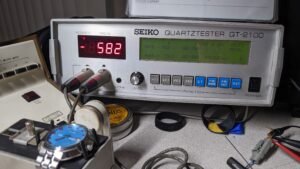
This printer was designed specifically for use with Seiko watch timing machines – devices which allow watch repairers to check the accuracy of both quartz and mehanical time-pieces. The Seiko Quartz Tester QT-2100 used by our customer appears to have been the last factory tool that was found more commonly in service shops globally. Being able to measure SEIKO Twin Quartz Cals. 94 and 99, this device catered to a few select high end Seiko watches in a manner that no one else can.
Those watches are expensive (even today) as they belong to a group known as ‘High Accuracy Quartz’ (HAQ) watches. These promise accuracy to +/- 5 seconds per year and the only way you can tune that is with the QT-2100 and one older (and much more clunky) sibling (the QT-99).

Seiko QT-2100P Printer
The QT-2100 remains a very useful tool for even today’s modern watches and so we wanted to not only replicate the output of the QT-2100P printer, but also see how we could make the data more helpful to the watch repair community. As well as being able to accurately measure the gain/loss of a mechanical watch movement, the QT-2100 can also cater for Quartz watches with either digital (LCD) or analog stepper motor driven mechanical movements.
The Retro-Printer was seen as a useful addition – providing new scope to the use of the tool for seeking period problems in a watch. A malformed or dirty tooth somewhere in the middle of the gear train only shows it’s self once in minutes, hours, or perhaps only once per day. This is when long-running logs are very helpful in identifying the source of the problem!
The Challenge
The first problem is that the QT-2100P printer is extremely rare – we have not been able to find anyone with one, although there are vaious photographs on the internet which shows what it looked like. After chasing various departments at Seiko, we managed to obtain English manuals for both the QT-2100 timing device and the printer, although Seiko did not find any technical details as to how the printer operates.

QT-2100P Operating Modes
The manual did at least include some sample printouts which cover the 4 modes of operation, which shows that the printer can depict:
a) Text output of the calculated daily rate of increase / decrease in seconds per day from a Quartz watch (Mode C)
b) A graphical representation of the Quartz watch from Mode C – in the manual this is described as a “level graph” (Mode B 1S).
c) A graphical representation of mehanical (analog) watch data at every beat showing the rate of change based on a slope of 10 seconds per day. The manual describes this as a “ramp graph” (Mode A 10S).
d) A graphical representation of mehanical watch data at every beat showing the rate of change based on a slope of 2 minutes per day as per Mode A 10S (Mode A 2M).
The only relevant specifications in the QT-2100 manual appear to be
- The user can set a gate time between 1 and 120 seconds
- For Quartz watches, the tester is capable of measuring and displaying the quartz watch timing rate to an accuracy of thousandths of a second – with the measuring rate being +/- 10.000 seconds per day.
- For the mehanical modes the measuring range is within +/-9,999 seconds. This seems excessive and a bit suspect. I don’t think any mechanical watch could every run that fast or slow. Most time graphing equipment won’t measure past 999 sec/day or 99.9 sec/day depending on the precision desired of the measurement.
With no technical information on this, a quick glance at the raw data revealed that a QT-2100P emulator was going to prove challenging.
Initial Investigation

QT-2100 Raw Data Output
All four print modes showed remarkably similar data, which were all some form of ESCape control sequence. There was no plain text in the printout and without a static display of the same data on the QT-2100 itself, correlating the control sequences with each reading on the machine initially appeared problematic.
We realised that by videoing the screen on the QT-2100, we could at least freeze each frame to get each reading as it happened and compare that with the data being sent to the parallel port.
Looking at the raw data, it is mainly made up of a series of ESC commands followed by up to 7 bytes.
We realised that the first three bytes of each printout (which are only sometimes apparent in Mode C for some reason) appear to be a header, which tells the printer which mode to use for the incoming data. This presumably also triggers the printer to output the correct header for the graph type and the grid lines which it needs to print.
Mode C Printing
Mode C seemed to be the simplest mode to try to replicate and so we decided to use Excel to try and rationalise the data captured by the Retro-Printer module, and work out how it correlates to the figures we know are being captured by the device.
By comparing the captured data with the expected figures noted on the LCD screen of the QT-2100, it became apparent that the format of each reading was:
ESC 1 NUL negativeFlag ?? val1 val2 val3
where:
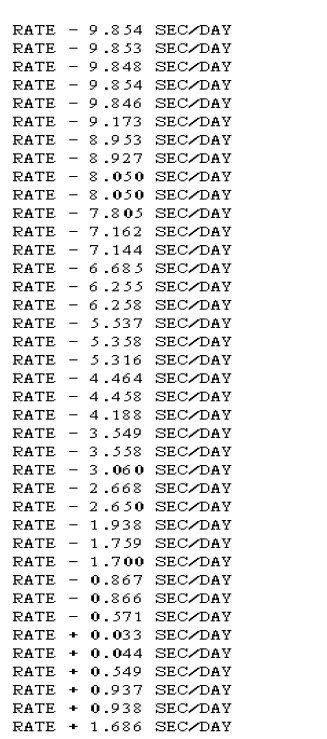
QT-2100P Mode C Actual Output
ESC 1 NUL is the start of a reading
negativeFlag – set to indicate a negative reading
val1 val2 val3 are the actual digits of the reading without a decimal point, allowing 2 digits per value, this gives you a maximum value of 999,999. Divided by 1,000 this gives the actual value and therefore is easily within the stated range of +/- 10.900
There was an oddity in that this could also output a short form of this command:
ESC 1 NUL 129
We could not determine what this command is supposed to do, so we decided to ignore it.
This then provided an acceptable output via the Retro-Printer with the values matching the observed original values shown on the QT-2100 LCD screen and the sample in the manual.
The next step is to decide how we can manipulate those readings to make the Retro-Printer even more useful for people trying to repair watches with the aid of the watch timer.
Mode B 1S Printing

Quartz Watch – Losing just 17ms per day
The Mode B 1S for Quartz watches is a little confusing, as the stated range is said to be +/- 10.000 seconds per day but the graph in the manual shows just 2 vertical solid lines at 1 second intervals and dotted lines at 0.2 second intervals which suggests that it actually only plots around +/- 1.5 seconds per day. Depicting a useful graph is also not easy, as the amount of gain/loss can be negligible – for example we had one watch which loses just 17ms per day (equivalent to just over 6 seconds a year if it were kept at a stable temperature).
With no clear images on the internet of the printer modes (the images in the manual are very poor), we have to assume that the graph should allow for +/- 10 seconds (well 9.999 as the LCD screen only allows for 4 digits) and therefore the manual extract is a small snippet of the middle part of the data.
As with the Mode C output, we get an introductory 3 bytes which act as a header to signify the plot mode (we assume!) followed by a series of readings. This time, the readings are in the format:
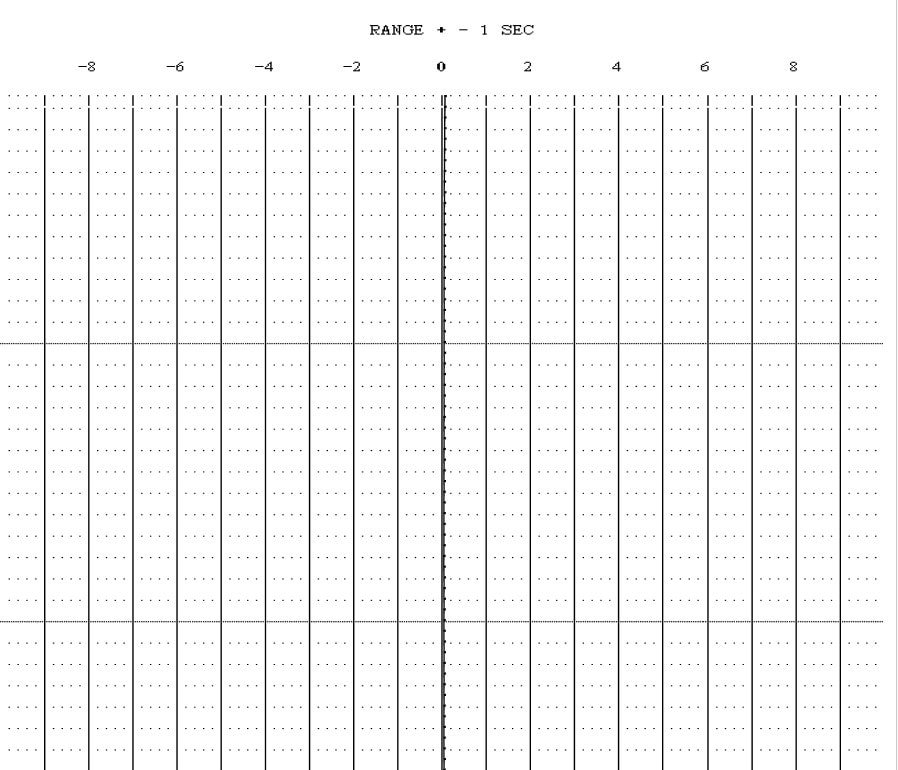
Mode B1S Test
ESC 1 $03 negativeFlag ?? val1 val2 val3
where:
ESC 1 $03 is the start of a reading
negativeFlag – set to indicate a negative reading
val1 val2 val3 are the actual digits of the reading without a decimal point, allowing 2 digits per value, although during testing val1 was always $00
So the first question is how to plot the data.
Here we had to assume that the printed page will need to display -10.000 seconds to +10.000 seconds – so we take the incoming value and multiply it by 1000 to give an integer offset. We then find the centrepoint of the page and calculate a scale factor to allow for 20,000 plot points across the page. We then add the positive or negative reading to the centrepoint and scale the result to see whereabouts to plot it on the printed page.
We then store the plotted position and use that to plot a line from the last known position to the latest position. This meant that we needed to create our own routine to plot lines between two points.
Horizontal lines were drawn after every 25 readings.
Mode A Printing

Measuring Manual Watch Escapement
The Mode A for mehanical watches was even more problematic. Here, the watch is powered by a spring and there is no battery, so the QT-2100 listens to the mechanical tick/tock sounds that come from the escapement system of the mecahnical watch. This initially made us think that the readings could be sound levels, as they appeared to be much higher than the Quartz testing modes.
Again the stated range is said to be +/- 9,999 seconds per day which would be a massive problem with the watch – plotting that against tested values which then seemed to be in the range of -12 to +12 made working out a feasible scale for the graph almost impossible.
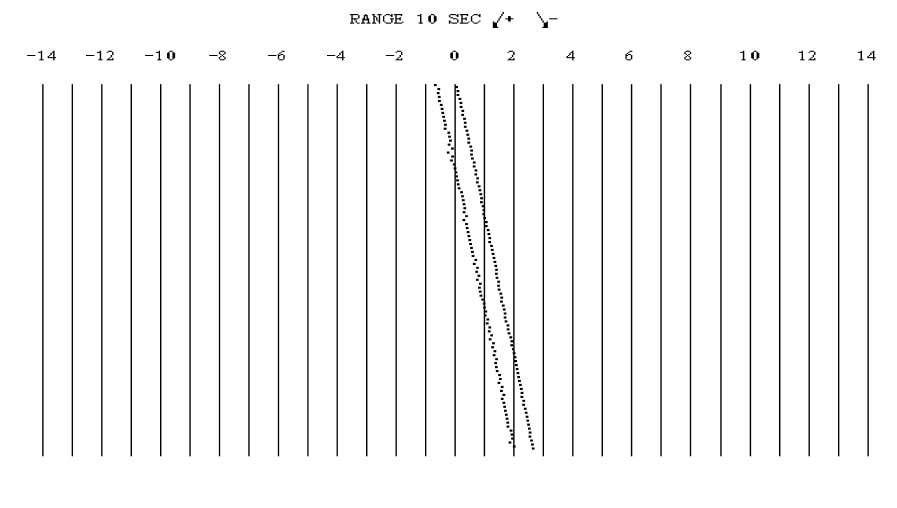
Mode A Test
Again the data includes an introductory 3 bytes which act as a header to signify the plot mode (we assume!) followed by a series of readings. This time, the readings are in the format:
ESC 1 $01/$02 negativeFlag ?? val1 val2 val3
where:
ESC 1 $01 is the start of a reading over 10 seconds (Mode A 10S)
ESC 1 $02 seems to signify a reading over 2 Minutes (Mode A 2M)
negativeFlag – set to indicate a negative reading – although this can be various numbers, it is mainly $20,$21,$30 or $31.
val1 val2 val3 are the actual digits of the reading without a decimal point, allowing 2 digits per value.
By comparing the recorded information from the video with the data caputred by the Retro-Printer module, we were able to ascertain that an odd negative Flag value indicated a negative reading. However, we are not sure what the remaining value represents (we did think it might be a tick as against a tock, but then some readings used the same value throughout!).
It was at this point that we struggled to understand how the QT-2100P extrapolated a graph from that data, as our various attempts ended up with more of a scatter graph with seemingly wide variations in readings which did not appear in a meaningful format.
After much experimentation and use of Excel to create graphs based on the data and our attempts to understand the data, it finally became apparent that the delta between the two points was equal to the beat error * 1000. A revised approach then suggested that the printer must keep an accumulated figure of the provided readings and plot that accumulated figure.
Implementing this in the Retro-Printer module led to graphs which closely reflected the expected data and so the Seiko QT-2100P emulator was born!
We will continue with experimentation and discussion with the community as to how to make the data even more helpful. Interestingly we found that on a manual watch which needed winding, the byte (shown as ??) immediately following the negativeFlag started to show values, which presumably means something.
The QT-2100P emulator is just one of the printers which we can emulate.